
Google Analytics is a powerful tool for discovering data about your website. Whether it’s finding out what content is most popular, or determining if your user is viewing your website from a mobile device, Google Analytics (GA) can provide you with all the information you need to accurately assess how your website is performing.
I’m going to show you the basics of the most popular (and free!) website analytics reporting tool by explaining three main sections of GA: Audience, Acquisition and Behavior.
How to Check To See If Google Analytics Is Installed
GA isn’t automatically setup on websites. You need to have a tracking code installed. If your website was created by PaperStreet, it will come equipped with GA.
Follow the steps below to determine if GA is installed on your website:
- Go to your website home page
- Right-click on the webpage and click on “View Page Source”
- Search for the phrase “Google-Analytics” (with the dash)
If you find a match, you likely have GA installed. While you are in the page source, make a note of your tracking code. This is found in the same section and will look something like this, UA-51693825-1. We will make sure the tracking code matches when we log into your account, so be sure to jot it down.
Google Analytics Not Installed? Learn How to Add GA to Your Website
How to Login to Your Account
Now that you have confirmed that GA is installed on your website, let’s move forward. In order to view the data, you need to login to the account that your GA is stored under:
- Visit http://www.google.com/analytics/
- Click “Access Google Analytics” or “Sign in” at the top right (this will lead you to the sign in screen)
- Enter your username and password and then click “sign in”
Once you have logged in you will see a screen the looks similar to the image below. You should see a tracking code listed on this page and it should match the one that was in the code of your website. This will ensure that you are looking at the correct data.
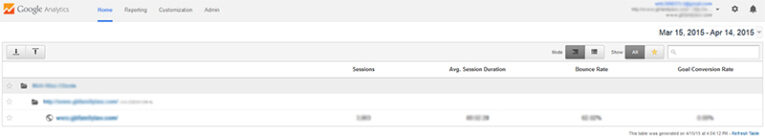
Learn Your Way Around the Dashboard
If GA was setup properly, you can click on the last link that has your domain name listed. Once you click on this link, you will be redirected to the main analytics dashboard titled “Audience Overview.” Let’s look at all of the different areas of the GA main dashboard.
On the left-hand side, you will find access to all of the different types of reports and data that GA has to offer. The next area that appears at the top of the page will allow you to share any GA reports either by email or exporting into many different file formats.
At the top right corner, you will find access to your date range. This tool is really helpful when identifying an overall traffic trend on your website. If you adjust the dates to be over the course of an entire year, you can easily see if traffic is going up, down, or staying consistent.
There is also a great comparison function. This allows you to compare data from different time periods. By default, GA will show you data for the past month. If you click “Compare to” you will see a comparison of the previous time period to the current. This is a useful function to determine if data on your website is improving.
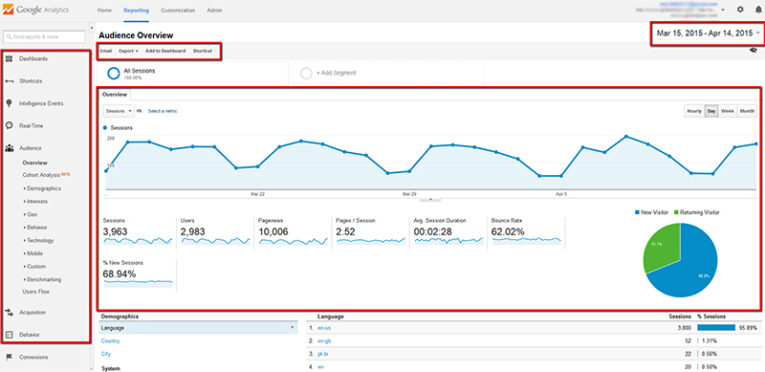
The middle section of the page is where all the data and graphs appear. As you click on different sections of GA, this area will change to reflect your search query.
Feel free to explore other areas within GA. You can do no harm by just clicking around and exploring what GA has to offer. Let’s dive into the specifics of each section and learn more about how this tool can help you better understand your website.
The Audience Section
The audience section is the first area I will review. By default, GA will open to this page. It includes a line graph that shows your traffic trends for the last month. Below the graph is the numerical data about how users are interacting with your website. To help you better understand the vocabulary on this page, a list of definitions from Google is below:
- Sessions: Total number of sessions within the date range. A session is the period time a user is actively engaged with your website, app, etc. All usage data (screen views, events, ecommerce, etc.) is associated with a session.
- Users: Users that have had at least one session within the selected date range, including both new and returning users.
- Pageviews: Pageviews is the total number of pages viewed, including repeated views of a single page.
- Pages/Session: Pages/session (average page depth) is the average number of pages viewed during a session, including repeated views of a single page.
- Session Duration: The average length of a session.
- Bounce Rate: Bounce rate is the percentage of single-page visits (i.e. visits in which the person left your site from the entrance page without interacting with the page).
Simply put, the metrics mentioned above provide you with an understanding of how many users are coming to your website, how many pages they are typically viewing, how long they are interacting with your website and how many users are leaving your website after they have only viewed one page.
There are two other sections within the Audience tab that I would like to mention before moving forward: Geo, and Mobile.
The Geo Section
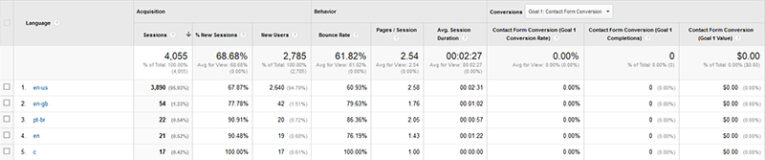
The Geo section houses two reports called Language and Location.
The Language tab shows you what language your users speak. If you are unfamiliar with the language codes. You can visit this language code table to better understand what they mean.
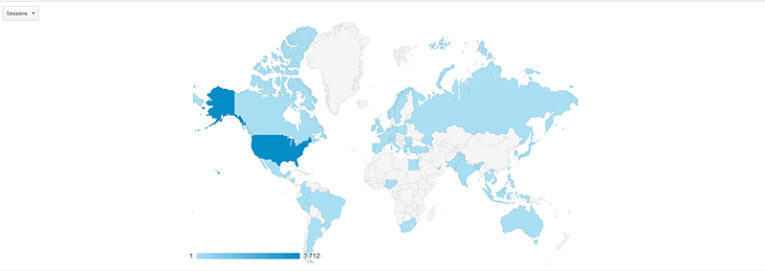
The Location tab shows you a map of where your users are located all over the globe. If you scroll down below the map, you will see a list of the actual countries. If you click on each country you can dive in deeper and see the actual states and cities of your users.
The Mobile Section
The Mobile section overview report tells you what devices (desktop, mobile or tablet) your visitors are using to view your website. If you see a large percentage of your visitors are looking at your website on a mobile or tablet device and your website is not responsive or mobile friendly, then you are not providing an optimal web experience for your visitors.
In addition, Google’s new mobile algorithm took effect in April 2015 and gives higher priority in search results for websites that are mobile friendly. If your website does not have a mobile view, your chances of showing up in the search engine results page on a mobile device will be greatly decreased.
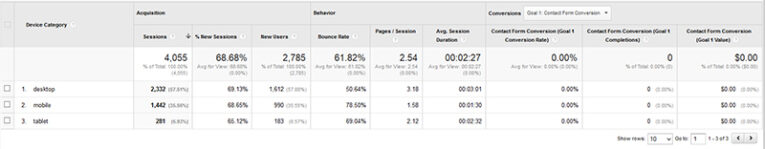
Another useful metric to look at is the bounce rate per device. If you don’t have a mobile-friendly or responsive website, there is going to be a better chance that your bounce rate is higher compared to desktop traffic. This means that visitors are coming to your website on their mobile device or tablet but are likely getting frustrated because of the poor user experience and are leaving your website before they visit any other webpages.
If you would like to see the actual devices (iPhone, iPad, Samsung Galaxy, etc.) your visitors are using, click on the “Devices” link in the Mobile tab. It’s also interesting to look at the bounce rate in relation to certain devices. There is a possibility that your website is not optimized for a certain size mobile device and could be causing a poor user experience.
The Acquisition Section
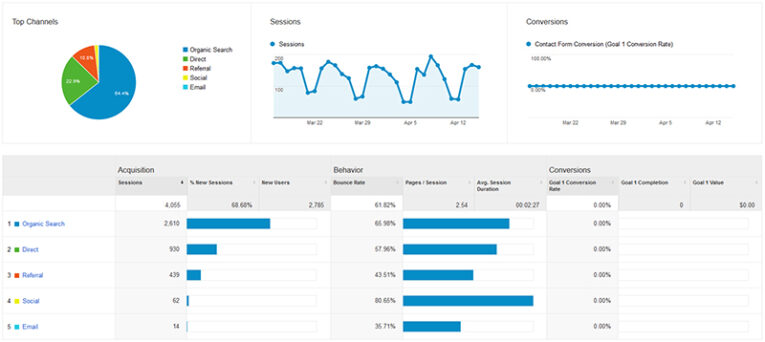
The Acquisition section is the second area I will be reviewing. By default, you will land on the overview page in this section. This data tells you what channels are driving the most traffic. By channels, I’m referring to either organic search, direct, referral, social, and email. Before moving forward, let me explain what each channel means:
- Organic Search: Users finding you by using a search engine
- Direct: Users finding you by directly entering your website address into the web browser
- Referral: Users finding you by clicking on a link that exists on another website
- Social: Users findings you by clicking on a link that appears on a social media network
- Email: Users finding you by clicking on a link that appears in an email
This data is very helpful in showing you what your most successful channels are. If you have been spending a lot of time and resources interacting on social media networks or sending email newsletters, this is a great way to measure those results. You can easily see how many sessions each channel is driving, along with other stats related to the bounce rate, pages per session, average session duration and even goal conversions.
In-Depth Information About Each Channel
If you click on each respective channel, GA shows more in-depth information. I’ve outlined below what data you will see after clicking on each channel.
- Organic Search: Keywords your visitors are using to find you
- Direct: Actual pages that a user has typed in to view
- Referral: Other websites that are sending traffic to you
- Social: Social media networks that are sending traffic to you
- Email: Actual pages that the user visited from a link in the email
The Behavior Section
The behavior section is the last area I will review. By default, you will land on the overview page. This section has similar statistics to the Audience overview page but it provides more in-depth information related to what content is the most and least popular on your website.
Site Content & All Pages
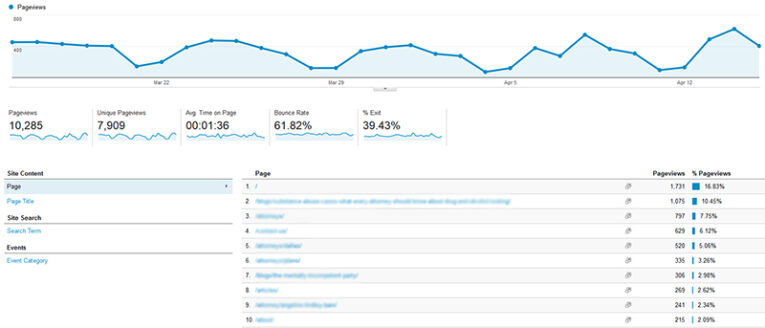
Let’s take a closer look to find out what your most popular content is on your website. Underneath the behavior section, click on “Site Content” and then “All Pages.” By default, GA will only show you the first 10 rows on each report. If you would like to see more rows, simply select a larger amount of rows in the lower right hand corner of the table.
If you are wondering what the backslash (/) means, it refers to your home page, which is often the most popular page. Google sees the home page as one of the most important and dominant pages on your website so it’s important to make sure it clearly communicates your objective of what your website is about and what you are trying to accomplish.
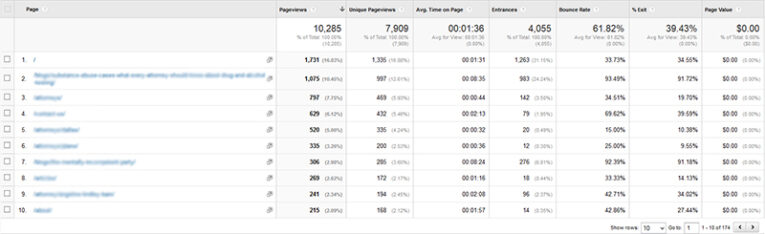
To the right of each webpage URL are the common metrics we reviewed earlier. However, it’s helpful to see these metrics with actual pages on our website. We can clearly see which pages are the most/least popular and how long the user is staying on the page. Below are the definitions from Google for a few new terms:
- Entrances: Number of times visitors entered your website through a specified page or set of pages
- % Exit: The number of exits divided by the number of pageviews for the page or set of pages. This number indicates how often users exit from that page or set of pages when they view the page(s)
Analyzing Your Content Metrics
It’s very useful to look at the bounce rate in relation to each webpage. Pages with a higher bounce and exit rate mean the user left the website after looking at this particular page.
It’s best to keep users engaged with your website, so if a particular page has a very high bounce and exit rate, it could be an indicator that something is wrong. It could possibly be off-topic and the user isn’t finding the information they were hoping for, so they leave your website.
On the contrary, we can see which pages are being interacted with the most by the amount of pageviews and the average time on the page.
Webpages with high metrics in those categories are the power pages on your website. You should also pay close attention to these pages to see if any improvements can be made. The data can also tell you what content is most popular and you can use that as an idea to develop more pages that are related to the topic in the form of blog posts.
Being an authority and a resource in your area of expertise is what it’s all about. You can use GA to find out what your users are paying the most attention to and take advantage of these opportunities.
Contact PaperStreet Today
PaperStreet’s team of legal SEO experts will provide you and your law firm with the knowledge and power to excel in search rankings. If you are interested in a free consultation or learning more about how PaperStreet can help your law firm achieve rankings in Google, please contact us.